VALE Observability Metrics
This concept was last updated March 19, 2026
If you're running a system that people depend on, you need to observe how well it's working. Throughput is a popular measurement for this purpose, but it's unfortunately a poor metric.
Why? Because throughput is a noisy proxy for (Availability * Latency) when Volume > 0 and Errors ≈ 0, where:
Volumeis the count of operations performed by a system"How much load is on the system?"
Availabilityis the gauge of the percent of traffic reaching the system"How much capacity is available?"
Latencyis the distribution of operations' latency"How smoothly is the system operating?"
Errorsis the count of failed operations"Is anything going really wrong?"
These are the VALE[1] metrics, and they form the core of observability (O11y).
To effectively gather and use VALE metrics, you'll need to understand three closely related concepts: SLIs, SLOs, and SLAs.
I adapted VALE from the VALET framework, which adds a fifth metric: Tickets (manual interventions). VALE drops the T to focus on metrics that can be collected even without mature operational tooling. ↩
Service-Level Indicators (SLIs)
An SLI is a specific quality measured directly from a system. SLIs answer concrete questions about what's happening:
"How many inputs have been processed?"
"How fast was each input processed?"
"How often does the system reject an input?"
SLIs are the raw signal that every other business metric is built on top of, and they come in many shapes.
Most SLI metrics fall into two categories: Core metrics that are measured directly, and derived metrics that are calculated from other metrics.
Core Metrics
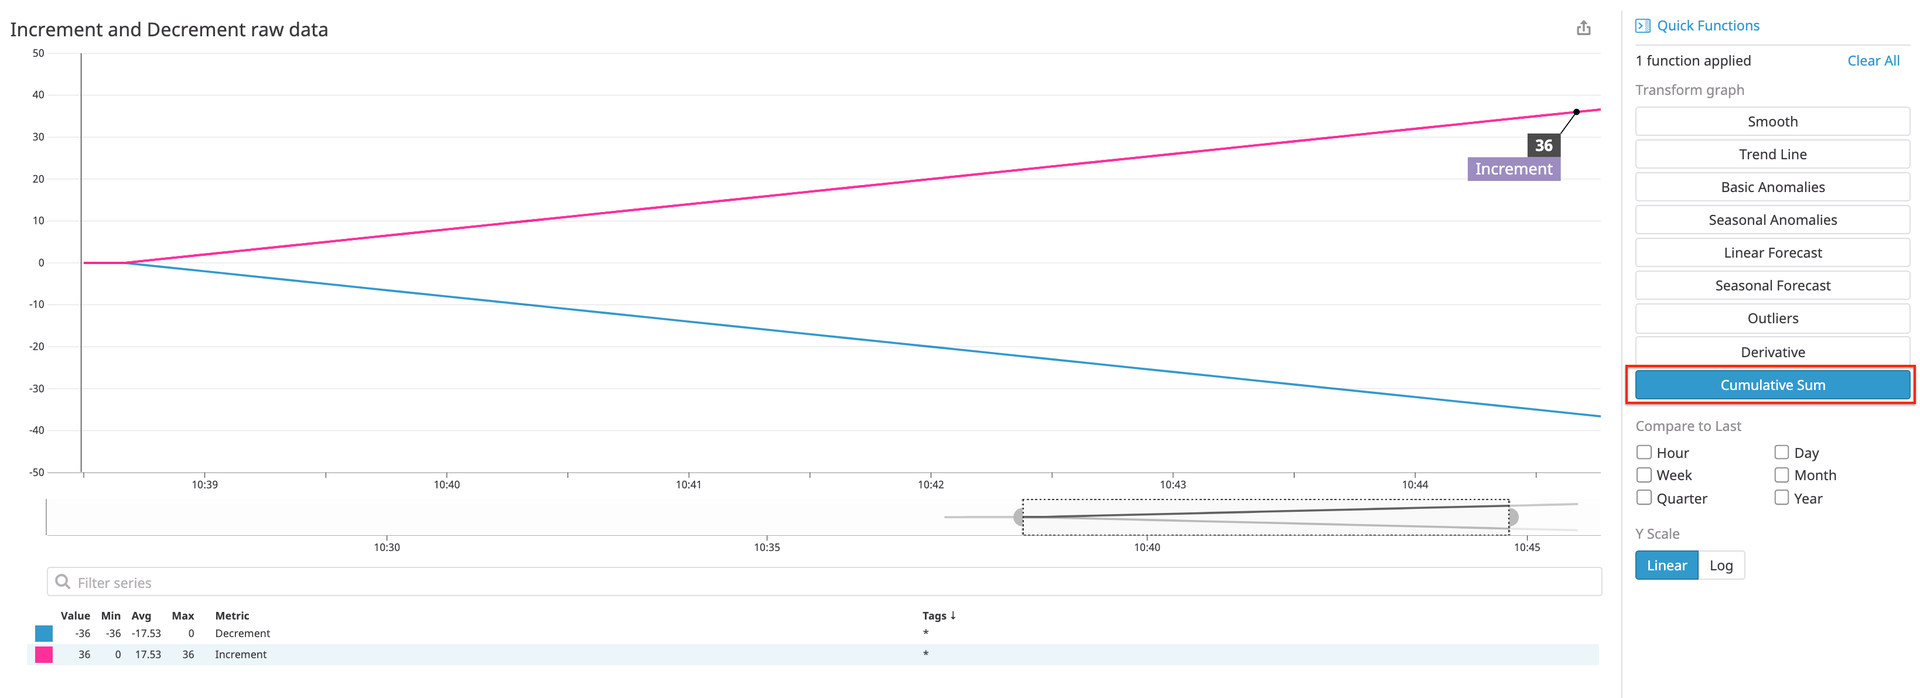
Counts measure continuous sums of something—the number of requests received, errors observed, or products processed by a system.
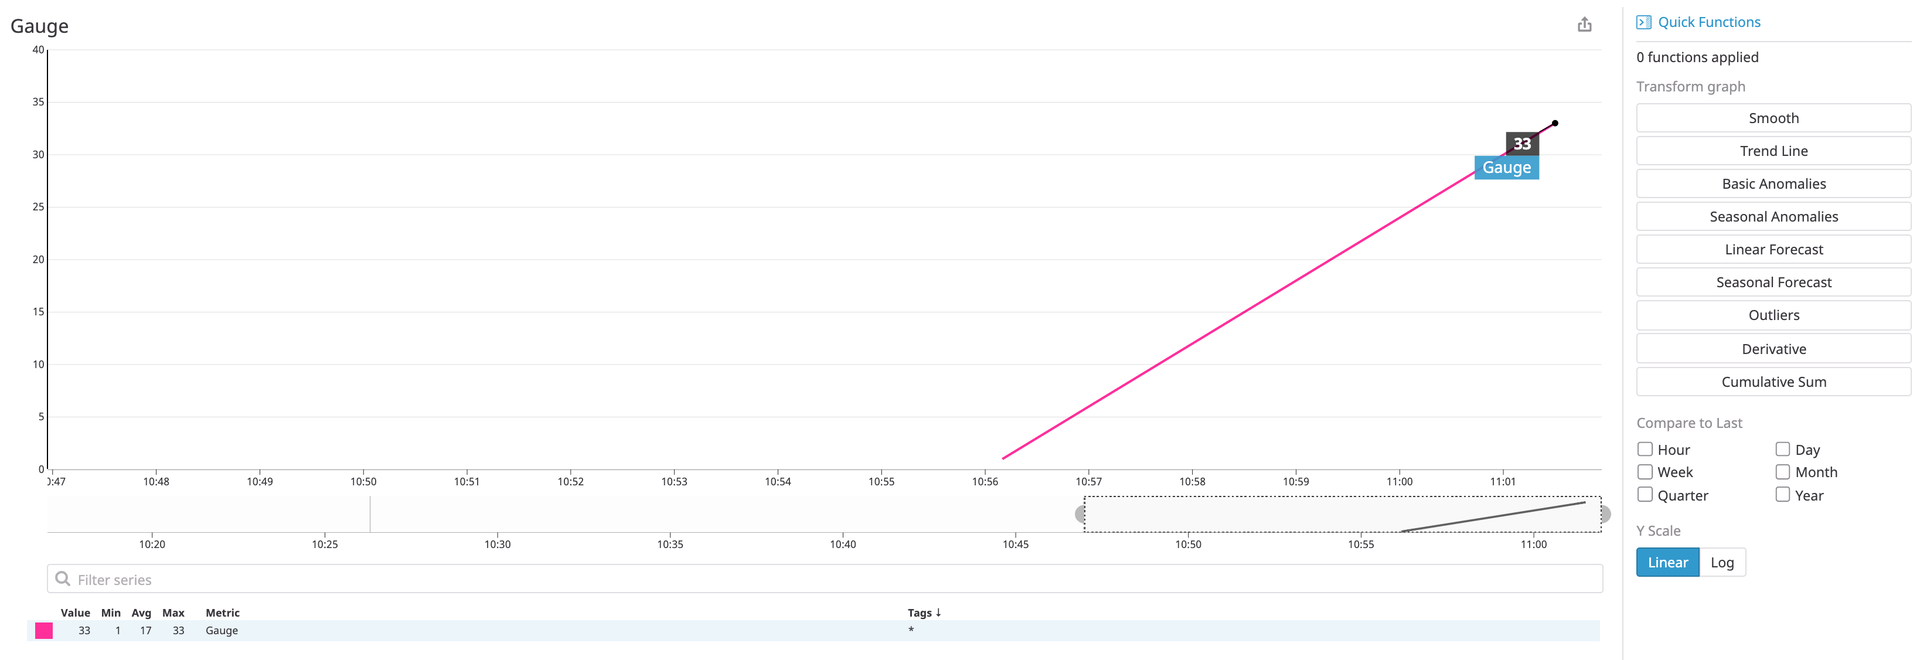
Gauges measure discrete values of something—the duration of a request, the size of an input, or the temperature of a CPU.
Derived Metrics
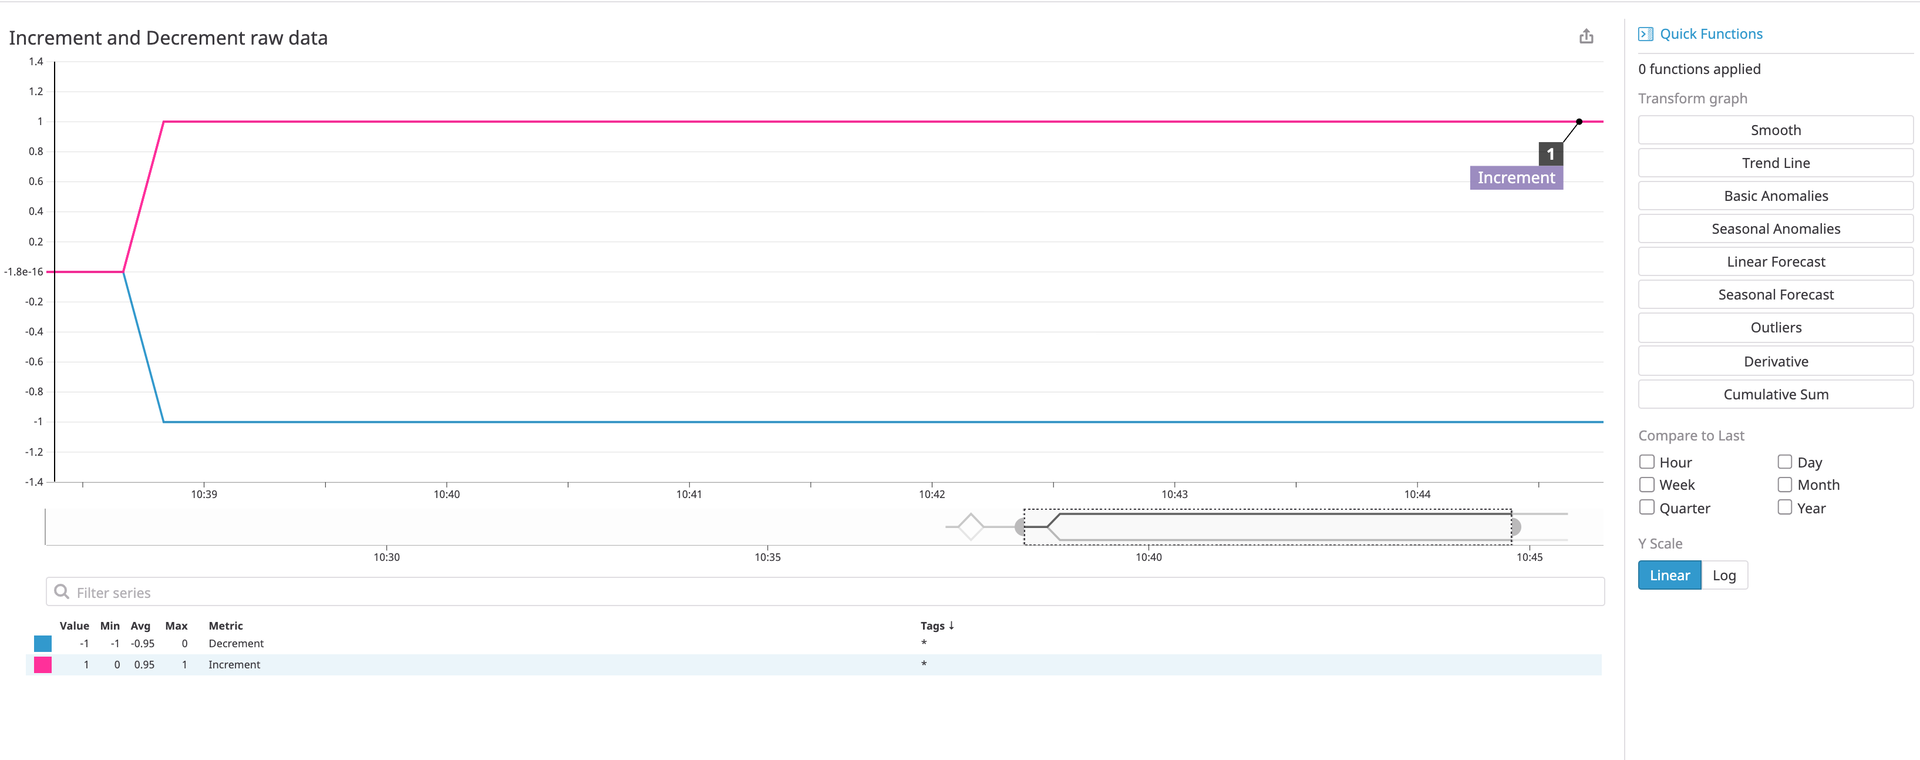
Rates measure a count over time—requests per second, errors per day, products processed per month.
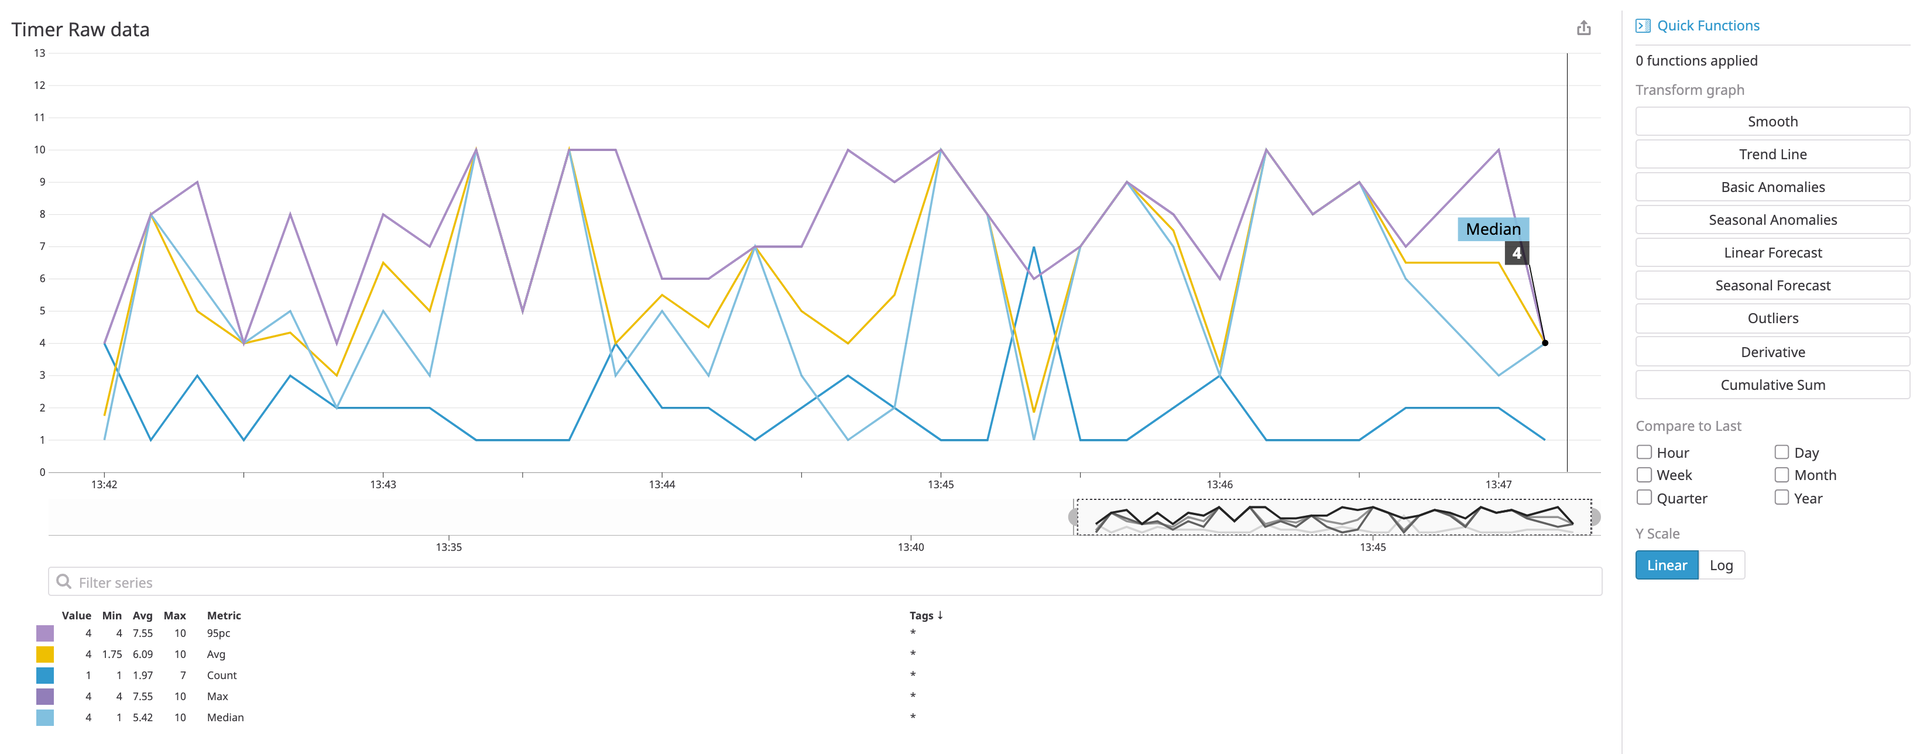
Histograms measure a gauge over time, capturing the mean, median, minimum, maximum, and rate of observed values.
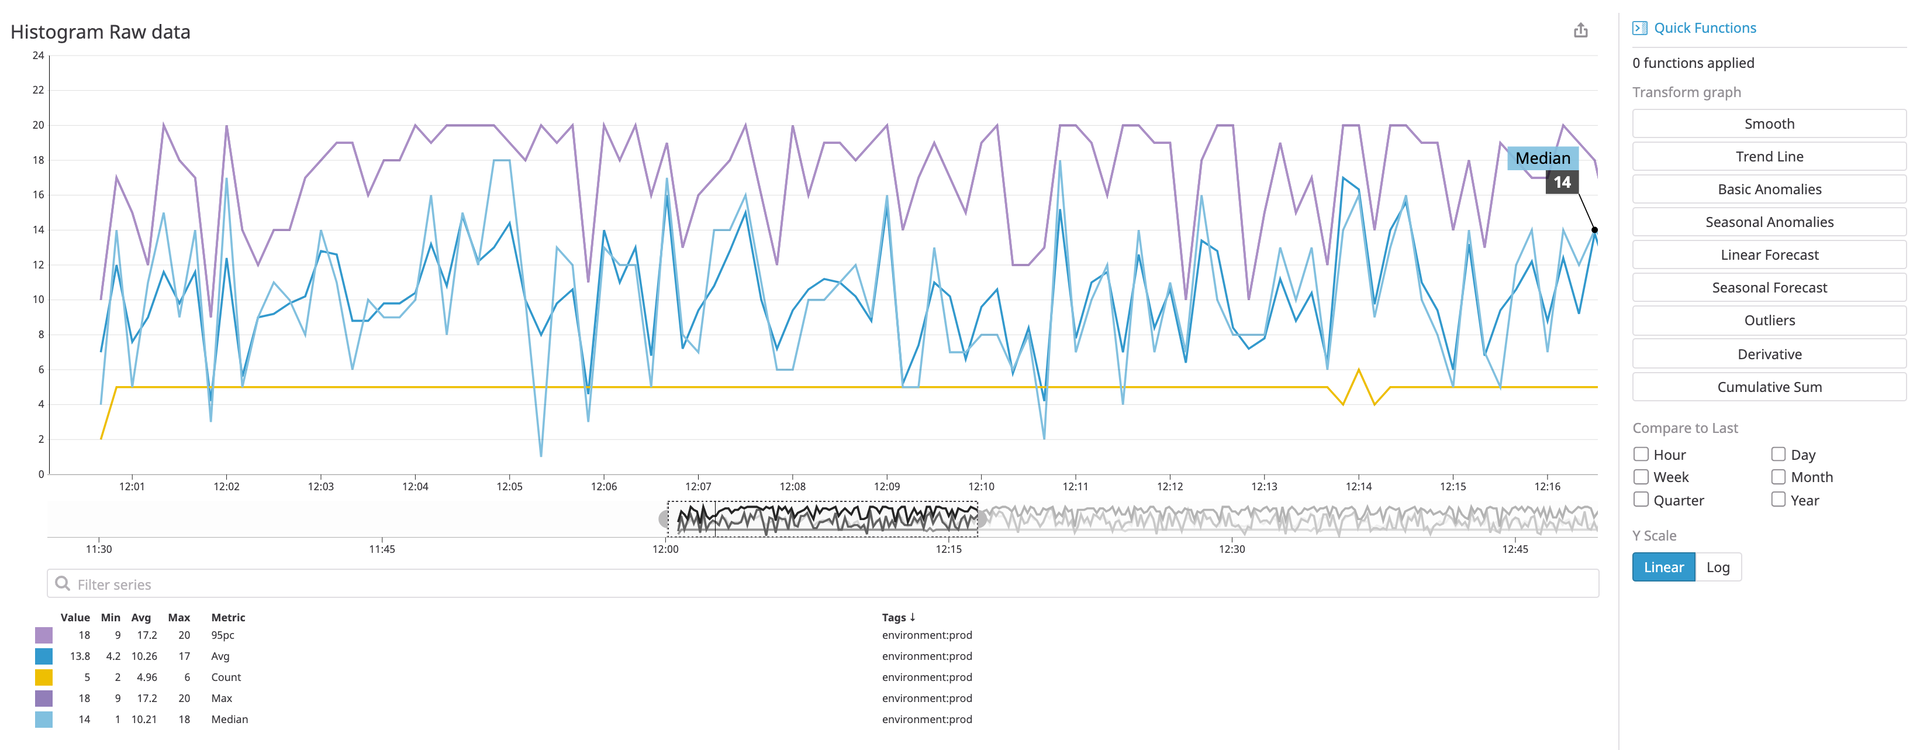
In distributed tracing platforms like Datadog, distributions are centrally-aggregated histograms that enable accurate percentile computations across multiple systems.
Service-Level Objectives (SLOs)
An SLO is an aspirational, internal goal that an SLI should meet. SLOs are targets that teams set for themselves:
"We want each processing stage to take less than
96ms""We expect fewer than
42errors per hour.""We expect less than
0.01%of valid inputs to be rejected."
SLOs are ambitious by design: If you're always meeting them, they're probably too loose.
Service-Level Agreements (SLAs)
An SLA is an external agreement with customers that systems' operators—and their SLIs—must meet:
"We guarantee every request is processed in under
420ms""We expect less than
0.1%of valid requests will fail.""We promise the mean-time-to-resolve errors will always be less than
9 hours."
SLAs should always be looser than your SLOs: Violating an SLA often carries a contractual, or at least social, cost.
How They Fit Together
Think of it as a stack:
SLIs are the measurements.
SLOs are the internal targets for those measurements.
SLAs are the external commitments backed by those targets.
If your SLIs breach an SLO, your team investigates. If your SLIs breach an SLA, your users are impacted and your team is accountable.
When your SLIs consistently meet your SLOs, the remaining margin is your error budget—the amount of unreliability you can tolerate before breaching your objectives. Error budgets turn reliability into a resource you spend deliberately, rather than a target you chase reactively.
© With Caer, LLC 2026
